The HETS dashboard
Everything you need to find, target and convert the right customers. Here's what's inside HETS.
Here's what subscribers get and how they use HETS to power their electrification strategy.
.png)
HETS lets you...
Size markets, track trends, segment audiences and uncover the drivers of adoption: transform homeowner insight into clear strategic advantage.
Topic Coverage
Heat pumps, solar, batteries, EVs, Tariffs, Smart meters, Funding the tech, Energy retailer brands, Sustainability
Insights
Tech adoption, buyer journeys, attitudes, energy supplier brands – perceptual mapping and switching
Territories
UK, France, Germany, US
Sample and frequency
4000 homeowners interviewed quarterly, 40,000 interviews to date. Country representative samples, incentivised respondents, full quality assurance
Dashboard tools
Built-in data visualisation including time series and overall charts. Precise “compare” and filter tools, chart exports, full notation, sample significance indicators, super-intuitive
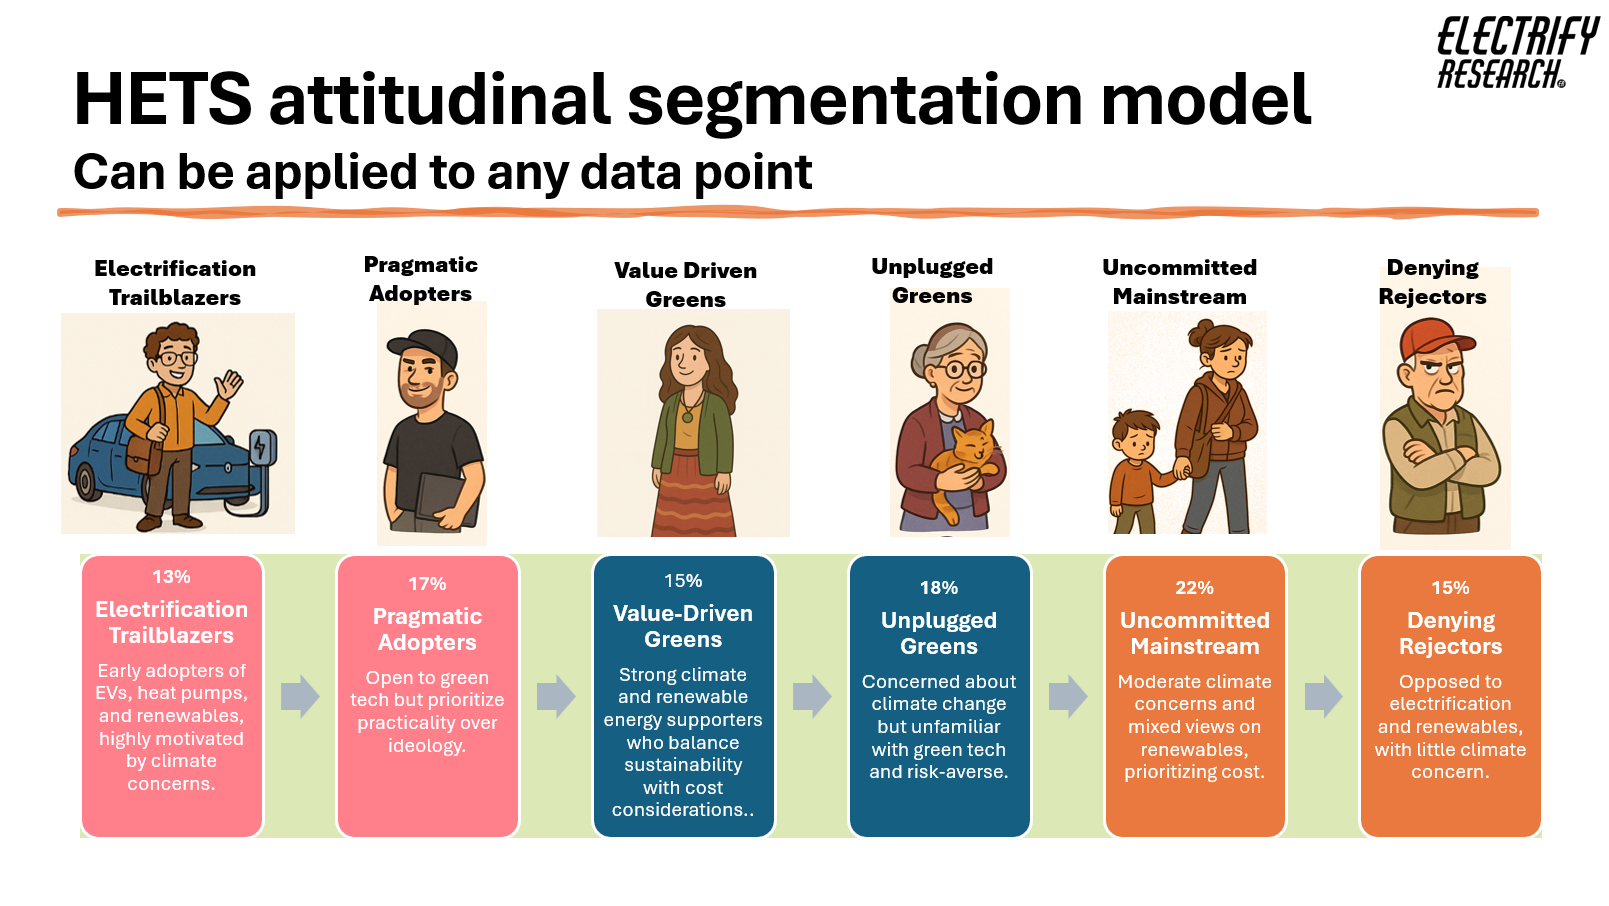
Segmentation
Six part Latent Class Analysis driven model identifying: Electrification Trailblazers; Pragmatic Adapters; Value Driven Greens; Unplugged Greens; Uncommitted Mainstream; Denying Rejectors.

Download the full HETS technical specification
Complete form to receive the spec immediately by email.
HETS features and benefits
Profile your audience
Curious about the typical person considering a heat pump (or a BEV or solar)? HETS reveals who your intended audience really is: their demographics, psychographics, attitudes, motivations and barriers. You use this audience insight to focus the resources of your organisation on targeting the people most likely to be interested rather than wasting money on those who'll never buy.
-
Identify the most receptive groups for each technology.
-
Understand their values and preferences.
- Build your own evidence-based personas for marketing, policy and product design, developing targeting strategies using messages that resonate with these groups.
.svg "audience_profiling_icon (5)")
Measure market trends
Distinguish between long-term shifts and short-term noise thanks to HETS's quarterly tracking.
- Tracking starts: August 2023 with consistent methodology.
- Time series charts built into every question.
- New data waves are updated promptly, meaning you're updated in near real time.
Size the prize
HETS lets you determine the total addressable market for every category it covers.
- 40,000 interviews to date providing statistically robust market sizing.
- Purchase consideration and intent metrics to quantify likely demand.
- Covers four territories (UK, France, Germany, US) to show differences by market.
-1.png?width=506&height=454&name=Untitled%20design%20(5)-1.png "Untitled design (5)-1")

Measure network effects
See how ownership of one technology accelerates others by looking at co-ownership and desired ownership by current adoption. This reveals how steep the "S curve" will be in each market and sub-market.
- The multi-technology coverage in HETS means we can see how each technology impacts on the others.
- By adding additional layers e.g. purchase intent, further filtering the sample, you get meaningful ways of estimating cross-sell opportunities.
Segment the audience
Use HETS’ six attitudinal segments - from Electrification Trailblazers to Denying Rejectors - to see which audiences are worth pursuing and how they shift over time.
Then follow up with filters / variables as proof points. Reveal hidden consumer groups based on shared attitudes to the climate, energy costs and energy myths.
- Use custom filters to augment our segments, or create your own.
- 29 "Comparison by" variables for granular audience profiling.
- 98 custom filters allowing custom segment creation.
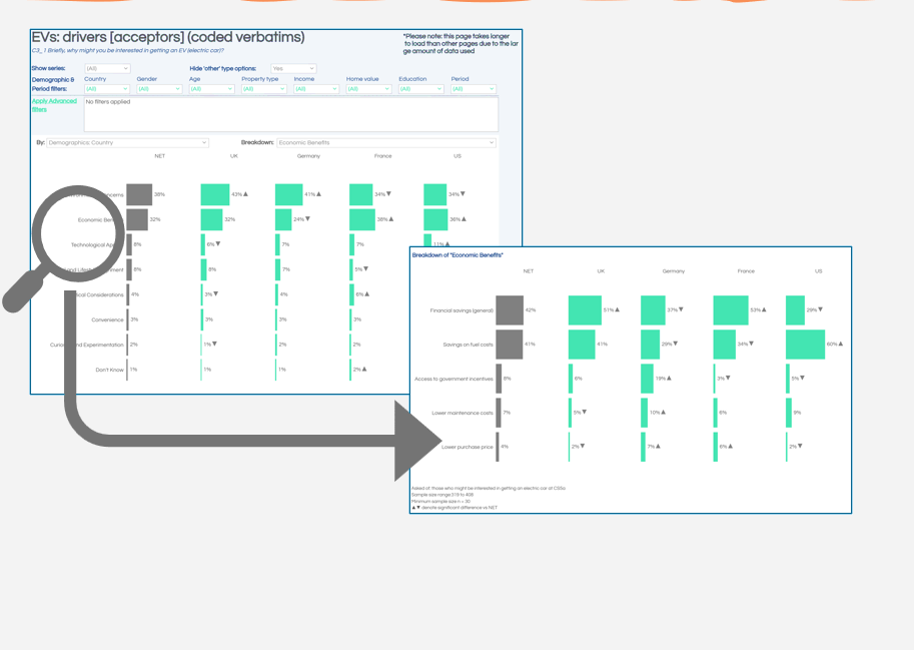
Analyse purchase journeys using AI
What really motivates or blocks adoption? We believe the best way of finding out is by asking open, unprompted questions, allowing participants to explain, in their own words. We then take their answers and use LLMs with carefully researched code frames, to categorise the comments into structured, quant data.
- Over 50,000 open ended comments captured and coded each quarter (half a million+ to date).
- Reveals unprompted, authentic, top of mind consumer motivations.
- LLMs create detailed parent/child coding structure allowing you to drill down into motivations around each technology (perceived benefits, drawbacks, drivers and barriers to purchase).
Understand the interplay between tariffs, energy suppliers and electro-tech
Learn how homeowner choices around technology, tariffs and energy suppliers interact.
-
Energy suppliers: current and past brand relationships, brand awareness, competitive brand strengths and weaknesses, switching intent, satisfaction.
-
Tariffs: options currently used and preferred for the future.
- Cross-analysis: filter results by technology adoption and purchase intent for deeper insight.